What to actually measure (and what to ignore)
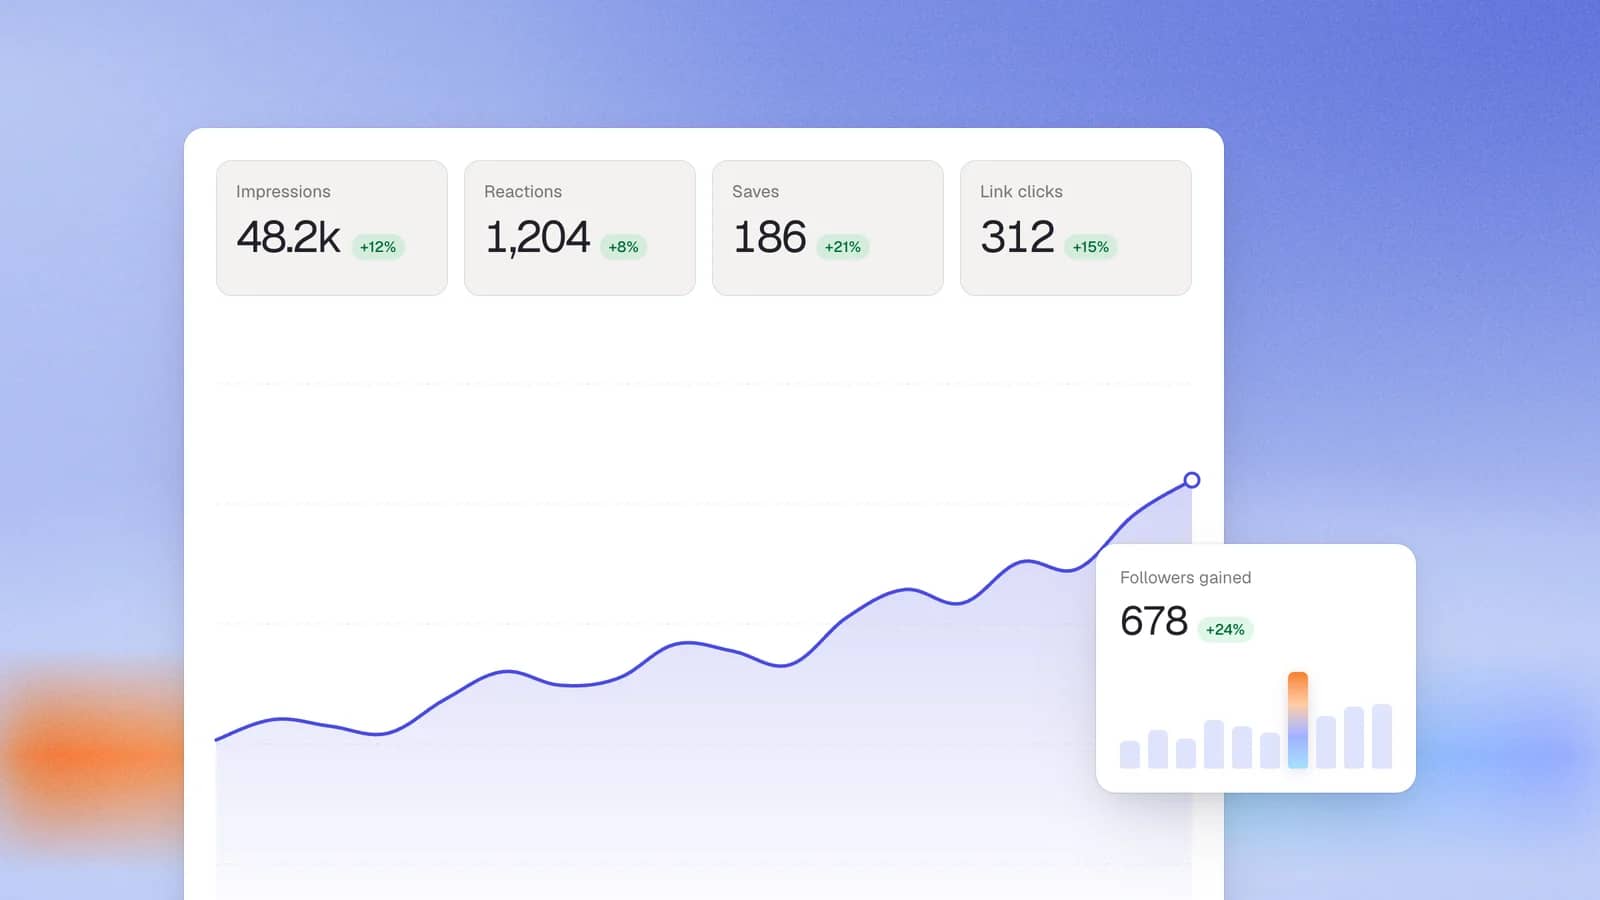
Measure the metrics that map to a business outcome, and ignore the ones that only move your mood. The fastest way to sort them is value versus vanity.
Vanity metrics feel good and prove little on their own:
- Raw likes.
- Raw impressions in isolation (a big number reaching the wrong people is worth nothing).
- Total follower count, disconnected from who those followers are.
Value metrics track whether the right people are engaging and moving toward you:
- Engagement rate: interactions divided by impressions, the quality signal behind reach.
- Reach within your target audience: in-network versus out-of-network, and whether you are reaching your ICP at all.
- Profile visits and follower growth inside your ICP, not follower count in the abstract.
- Link clicks, saves, and sends: intent signals that someone wants more.
- Downstream conversations and enquiries: the closest thing to revenue.
My rule, both as an engineer and an operator: pick a small set tied to your goal and track the trend over time. A metric only matters if it maps to an outcome. If you cannot draw a line from a number to a business result, stop reporting it.
What LinkedIn's free analytics give you (and where they stop)
LinkedIn's native analytics are free, for both personal profiles and Company Pages, and they recently got better. As of a June 2026 expansion, LinkedIn's native post insights now show saves, link clicks, followers gained from a specific post, and a new Reach metric that separates people already in your network from those discovering you for the first time. For finding and reading these, LinkedIn's own help pages have the step-by-step, and I would rather link you there than repeat it.
Here is where native stops. It cannot cleanly separate your organic (personal-profile) reach from your company-page reach, which I will come back to because it is the most consequential gap. It keeps limited history, so long-term trends are hard to see. It gives you no cross-account or team view, so reporting on many profiles means pulling each one by hand. And it makes attribution to actual business results difficult. None of this is a knock on LinkedIn; native analytics are a genuinely useful free starting point. They are just built to describe individual posts, not to prove a content program works.
What's a good result? LinkedIn benchmarks
A good LinkedIn engagement rate in 2026 is above 2%, and above 5% is excellent. The current median sits around 4.7%, per Socialinsider's 2026 analysis of over 5 million business pages, up from 3.85% in 2024. Here is how the key numbers land today.
| Metric | Benchmark (2026) | Source |
|---|---|---|
| Engagement rate (median) | ~4.7%; over 2% is solid, over 5% is great | Socialinsider, Q1 2026 |
| Best-performing format | Document carousels, ~7% engagement rate | Socialinsider, 2026 |
| Engagement by industry | Education ~3.0%, Finance & Insurance ~3.2%, most sectors ~4–4.7% | Socialinsider, 2026 |
| Personal profile vs company page | Personal reaches roughly 5–8x the page | Sprout Social / industry reporting, 2026 |
Read these as a compass, not a target. Your own trend month over month tells you far more than any median, because a 3% engagement rate that is climbing beats a 5% that is falling.
Do not panic about the impressions drop. Reach per post is down across the platform while engagement per surfaced post is up, so the game shifted from "how many saw it" to "did the right people act on it."
The metric most tools get wrong: organic vs company-page reach
The single metric most tools get wrong is separating organic reach from company-page reach. These are two completely different things. Your personal-profile posts (organic reach) and your company page reach different audiences through different parts of the algorithm, yet native analytics and many legacy tools either blur them together or split them badly. When that happens, your reporting quietly lies to you.
This matters more than it sounds, and it is worth being precise about as an engineer. Personal profiles drive the large majority of reach on LinkedIn, several times more than the company page. So if your dashboard blends the two into one "reach" number, a healthy-looking total can be almost entirely the page, while the people-powered content that actually builds B2B trust is flat, and you would never know. You cannot improve what you cannot see separately.
Scripe separates organic reach from company-page reach as a first-class distinction, because when we built the analytics we treated it as the thing that decides whether a report is meaningful.
How to measure the ROI of your content
The honest ROI of organic content is measured through leading indicators and tracked influence over time, not a precise per-post dollar figure. Anyone promising exact per-post ROI on organic content is selling false precision. The path from a post to revenue is long and indirect, especially in B2B, so the credible approach layers three things.
- Leading indicators. Qualified reach, ICP engagement, profile visits, and link clicks. These move first and predict pipeline.
- Tracked links. This is the closest honest connection from content to outcome. A tracked link shows which profile or post drove a click and where it went, so you can see content turning into site visits and enquiries.
- Pipeline influence over time. Deals where the buyer engaged with your content before or during the cycle, tracked over months rather than attributed to a single post.
Earned media value can be a useful directional figure (what the reach would have cost in ads), but treat it as a rough indicator, not revenue. The point of all this is to answer your CEO's real question, "how does this make money," with content framed as measurable business influence rather than vanity reach. OMR did exactly this: when their team moved budget out of LinkedIn Ads into organic content, they generated around 10 inbound leads a week and stopped running ads altogether, a clear read on ROI without a fake per-post number.
Reporting across a team or client accounts
Reporting across many accounts needs one dashboard, because doing it by hand does not scale. The default for most marketers and agencies is brutal: log into each account, export or copy the numbers, paste them into a spreadsheet, repeat every month. It is slow, it is error-prone, and native gives you no cross-account view to begin with. Worse, without the organic-vs-page split, the report can be confidently wrong.
What good looks like is every profile in one view, with clean export for client reporting and click tracking to show what content actually drove. This is where a purpose-built layer earns its place. ColdIQ, a GTM agency running content across more than 20 team members, put the value of that single view plainly: "Having analytics across the entire team was a game changer. We can see how often people post, what performs, and what gets engagement, all in one place." Scripe provides that cross-account reporting, with export and click tracking, so you can prove value instead of assembling it by hand.
Measure what actually proves your content works
Likes are not proof. The metrics that matter are the ones you can trace to a business outcome: reach among the right people, clicks, conversations, and pipeline influenced over time, read against real benchmarks and with organic reach separated from your company page.
That last part is the hard one to do by hand, and it is what we built Scripe's analytics to solve: see organic versus company-page reach, track clicks from content to your site, benchmark against your niche, and report across one profile or many, so you can show your CEO or your client that content works.
If you want measurement that proves business value instead of describing posts
try Scripe for freeFAQs

Co-Founder & CTO
Christoph Meise is Co-Founder and CTO at Scripe, where he leads engineering and product development with a focus on building intuitive, high-performing user experiences. With over a decade of engineering experience at multiple companies he combines deep technical expertise with a strong instinct for how technology should actually feel to use. His academic foundation, a Master of Science in Business Informatics from Freie Universität Berlin and a Bachelor of Applied Science in Computer Science from Baden-Wuerttemberg Cooperative State University (DHBW), grounds his engineering approach. He previously co-founded and architected an online platform connecting entrepreneurs with investors, sharpening his focus on building systems that serve real user needs end to end. At Scripe, Christoph has led the product through multiple rebuilds, including a shift to become an official LinkedIn API partner and the launch of a self-learning content agent, work centered on making powerful technology feel effortless for the people using it. Christoph shares his perspective on LinkedIn growth, product development, and building with AI to a following of over 11,000 on LinkedIn.
LinkedIn